What’s the difference between gross sales vs. net sales?
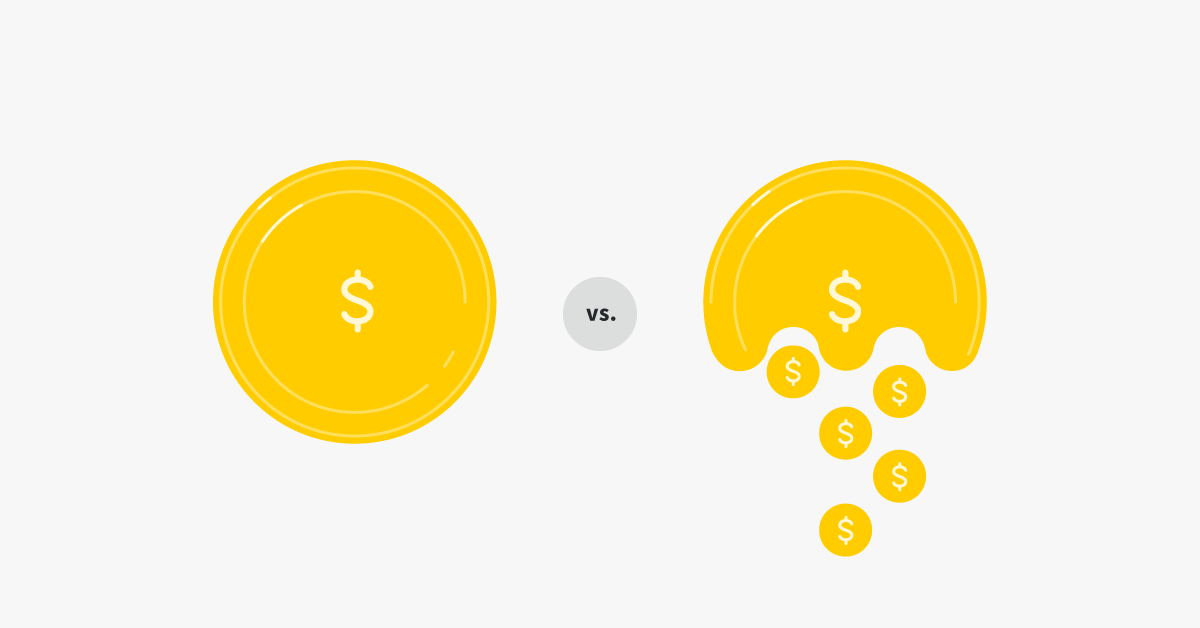
Accurate sales forecasting is critical to your success. It paints a picture of where your business is going, sets realistic quotas for your sales team and helps you make informed business decisions.
Despite its importance, a study from Gartner found that only 45% of sales leaders have high confidence in their forecasting accuracy. But how exactly can you improve your forecasting accuracy?
A good place to start is to understand your total sales and revenue, which involves keeping tabs on gross sales and net sales.
In this post, we’ll show you how to calculate your net and gross sales so you can create accurate sales forecasts. We’ll walk you through the formulas, outline their differences and show you how to identify issues or opportunities within the sales process.
Calculating your gross sales vs. net sales
Let’s start by clarifying the formulas for calculating your gross and net sales.
How to calculate gross sales
Gross sales is the total amount of sales without any deductions.
To calculate your gross sales, simply multiply the number of units you’ve sold by the unit price. So, if you sold 200 units in Q1 and the unit price is $40, your gross sales revenue (also called gross profit) is $8,000 for that quarter.
Gross sales formula:
Gross sales = Number of units (gross sales price) x Unit price/cost
How to calculate your net sales
Net sales is the sum of your gross sales minus any deductions, such as discounts, returns and allowances (we’ll look at these deductions in more detail later). The closer your net sales are to your gross sales, the higher your profit margin.
Net sales formula:
Gross sales = Number of units (gross sales price) x Unit price/cost
As all the deductions have to be made retroactively, you can only calculate your net sales at the end of the sales period.

How to add gross and net sales on an income statement
Gross sales and net sales will feature in your financial statements, specifically as the top line on the company’s income statement (also known as a profit and loss statement).
A business might start by declaring its gross sales (commonly referred to as gross profit or total gross revenue), then listing the different sales deductions made as line items (which are the net sales). Other companies skip the part of identifying the gross sales and deductions and simply list the net income or net revenue.
If the deductions aren’t on the income statement, you’ll find them in your company’s contra accounts (an account used in a general ledger to offset the balance of a related account).
When the income statement is finished, you can use this information to calculate your sales tax and inform your future sales activity.
How do deductions fit into the equation?
There are three specific types of deductions to consider when it comes to gross vs. net sales: discounts, returns and allowances.
Gross sales incorporate all of these deductions, while net sales are a company’s gross sales minus these three deductions.

Let’s look at them in more detail.
Discounts
Sales discounts apply to any early payment discounts which are offered to customers when they pay an invoice within a specified period.
For example, your company might send a customer an invoice for $10,000 to be paid within 30 days. However, you could offer a sales discount of 1% off if they pay within 10 days (this particular offer would be known as a 1/10 net 30 in discount terms).
In that case, the customer would only pay $9,900, getting a $100 discount for early payment in that specific period.
The exact terms of a discount vary from company to company, but the general idea is to create a mutually beneficial outcome for both parties. The seller gets their invoices paid faster, allowing them to maintain a healthy cash flow, and the customer doesn’t have to pay full selling price.
In this context, “sales discounts” doesn’t refer to sales promotions, promotional discounts or rebates and seasonal offers, it only applies to the early payment discount.
Returns
Sales returns allow customers to return an item for a full or partial refund within a certain number of days.
From damaged goods to late deliveries, customers can decide to send the product back for a variety of reasons, and as long as they’re in line with your return agreement, they can request a refund.
This is a cost you have to consider when calculating net sales.
When the order has been returned, the refund is credited to the customer’s account. Regardless of whether you’re able to resell those items again or not, the refund needs to be deducted from your gross sales and gross income.
Allowances
If there are minor issues with the delivered product after a sales transaction but it is still usable, the seller and customer might agree to a compromise. Rather than the customer having to return the goods, the seller could propose a partial refund against the paid invoice. This discount would then be recorded as an allowance.
For example, imagine that your customer ordered $3,000 worth of your product, but they receive the wrong color. While the product still functions correctly, the customer might ask for compensation given that the delivered goods weren’t as described. To keep the customer happy, your company might offer a partial refund of $300.
In terms of gross and net sales, let’s say your gross sales for Q1 were $8,000, but over the same period of time, there were $700 in sales discounts – $200 in sales returns and $100 in sales allowances. These would need to be deducted from the sum of all sales. This would give you a figure of $7,000 net sales vs. a gross sales figure of $8,000.
4 benefits of knowing your gross sales and net sales
Let’s take a look at some of the benefits that come with understanding and analyzing your gross and net sales.
1. Avoid misleading figures
While it can be tempting to rely on gross sales as a measure of performance (as it’s always going to be equal to or higher than the net sales), it can be misleading. If you’ve had to refund most of those sales, you’re not using accurate sales numbers for your forecasting.
This is where reviewing net sales alongside gross sales comes in handy.
Gross sales allow you to measure the total amount of revenue made by your sales team, whereas net sales are a better measure of performance, sales tactics and product/service quality.
By combining the two, you get a more accurate representation of your current sales performance. As a result, you can create informed and strategic sales forecasts.
2. Make better decisions
Analyzing gross and net sales helps guide your decision-making process. It gives you real insight into your sales performance, which helps you make informed and strategic decisions.
For example, a key part of sales forecasting involves setting a realistic budget. Based on your gross and net sales, you can see where to allocate spending, how much to allocate and where spending might not be necessary.
It can also inform decisions about your product or service. If your gross sales are high but net sales indicate that one of your products is being returned more than usual, you can use this information to identify what’s wrong. Then, you can make changes to provide a better product or service to your customers.
3. Run a competitive analysis
As well as a general indication of your business’s financial health, net and gross sales can also be a benchmark for competitive analyses.
Compare your own figures with competitors to see how you’re performing in the marketplace and identify new opportunities and areas of improvement in your existing sales processes.
For example, if your net sales figures are considerably lower than your competitors, there’s cause for investigation. You may need to adjust your pricing, amend your product features, or upgrade your product quality to gain a competitive advantage.
On the flip side, if your net sales are consistently higher than your competitors, it shows that you’re doing something right. As a result, you can confidently double down on your strengths and make smart business decisions for the future.
4. Motivate your sales team
If you know the difference between gross and net sales company-wide, team-wide and individually, you can accurately measure and analyze performance. This means you can monitor sales performance and set goals that motivate your sales team to focus on the right targets.
For example, if you dig a bit deeper and analyze your top-performing rep only to find out that most of their gross sales are cut in half when considering net sales, perhaps their deals aren’t as valuable as they seem.
You could use these metrics to help steer this rep, and the team, in the right direction. You might bundle your set gross sales KPI with qualified leads and most likely to close KPIs. This forces your reps to focus on high-budget and high-quality deals in tandem, motivating them to prioritize big business and high-value business equally.
How to use gross sales vs. net sales to identify (and overcome) challenges
Understanding the differences between gross and net sales puts you in a good position to spot when sales aren’t going to plan.
For example, if the gap between the gross sales and net sales is decreasing, that means the rate of deductions is also decreasing. In other words, your sales process is in good shape.
On the other hand, if the gap between the two is increasing, something’s not right. You’ll have to do some detective work to diagnose the cause.
Here, we’ve outlined some of the common causes that can increase the distance between gross and net sales, as well as some advice for how to get your sales back on track.
Your early-payment discount is impacting revenue
Net sales show you how many customers are using your early-payment discount. If these discounts are increasing, it means more of your customers are paying their bills promptly. This gives your business a healthy cash flow, but if the discount is too high or if too many customers are using it, it can affect your final sales figure.
In this situation, you need to re-evaluate the early payment terms. Here’s where you begin:
Take a look at the percentage. If the percentage of discount is too high, bring it down so that it no longer impacts your total revenue quite as much. The exact amount will vary from business to business, so work out how much you need to deduct from the percentage based on the impact it’s already had on your sales.
Analyze your competitors. If your competitors are also offering early-payment reductions, take a look at what they’re doing. That way, you can try to retain a competitive advantage without negatively affecting your cash flow. You might need to reduce the discount you provide early-paying customers. But if you’re offering 10% and your competitors are offering 5%, you can still offer 7% to reduce your loss of revenue and still beat your competitor.
Review the time frame. Offering a shorter time frame to make the early payment can reduce the number of people that use it. For instance, if you used to provide 30 days but now offer 14, there’s less chance customers will fulfill the payment by the deadline. You can offer the same discount but reduce the pressure on your overall revenue.
You have an increasing number of product returns
Your gross sales might look great, but if your business is getting a lot of returns, your net sales will show it.
If you’re experiencing an increase in returns, start by identifying the main cause. Usually, there are return authorizations in place to record the reason for a return. If that’s the case, you’ll be able to see whether there are any opportunities to improve the manufacturing, quality control, delivery and other sales processes to reduce the number of returns.
For sales teams, the biggest concern is if products are returned because they don’t meet the buyer’s requirements. This could mean that your product needs redesigning, or that your sales process is targeting the wrong people. In this case, you’ll need to review your ideal customer profile to make sure you’re reaching out to the right people.
You’re providing too many allowances
If you find your business offering allowances on a regular basis, something needs to change. Continually offering allowances not only impacts your revenue, but it can make it harder to accurately forecast your future sales.
Review the reasons behind the allowances and see if you can spot any common themes.
For example, if 80% of allowances are due to a delay in shipping, you know where to look to put things right.
Gross sales, sales, gross revenue and revenue
When it comes to measuring business performance, it’s important to understand the difference between gross revenue vs. sales and revenue vs. gross sales. Gross revenue represents the total income generated by a business, while sales refer to the revenue generated from selling products or services.
On the other hand, revenue and gross sales are similar terms that represent the total income generated from sales. However, revenue may be calculated after deducting any returns, discounts or allowances. Accurately tracking and analyzing these metrics can help businesses identify areas for improvement, optimize their sales strategies and make informed decisions to drive growth and profitability.
Use Pipedrive to manage your revenue
Pipedrive’s revenue management software allows sales teams to track revenue, sales (including gross and net sales) and invoices – all from one location.
Instead of clicking back and forth between various Excel spreadsheets, Your sales team can easily access key information from wherever they are, share instant updates and use our reporting and analytics to delve deeper into their sales performance.
Sign up to Pipedrive for a free 14-day trial to get started.
Final thoughts
While gross sales vs. net sales are terms that may be more familiar to accountants and investors, knowing what these mean as a salesperson or sales manager is still vital. It can give you a strong indicator of business performance and help identify any potential issues before they become serious problems.
Understanding gross sales vs. net sales and tracking how the figures change over time will let you see what’s holding your sales back and review your processes to improve performance across the business, including your sales process.
Валовые продажи и чистые продажи
Эти два условия в основном используются для отражения финансовых показателей организации. Как валовые продажи, так и чистые продажи помогают определить продажи, выполненные бизнесом, они дают полный анализ продаж бизнеса, и оба они рассчитаны на определенный период времени. Большинство людей читают финансовые отчеты компаний, в которых они владеют акциями или являются потенциальными акционерами, чтобы оценить его эффективность.
Поэтому для таких людей важно понять разницу между валовыми продажами и чистыми продажами, чтобы максимально использовать данные. Валовые продажи — это общая сумма денег, которая получена, а чистые продажи — это общая сумма после определенных вычетов. Некоторые из этих вычетов включают налоги, доставку и сборы. Чистые продажи, как правило, ниже валовых продаж, поскольку на них приходится дополнительные вычеты.

Что такое валовые продажи?
Это сумма нерегулируемых продаж, что означает, что они представляют собой общий объем продаж до любых скидок, пособий и возвратов.
Скидки для продажи — скидки досрочного платежа. Например, заплатив 5% меньше, если покупатель платит в течение 10 дней с момента начисления счета. Скидка применяется только при получении наличных денег от клиента, поскольку это является тайной для продавца, на котором покупатель получит скидку.
Резервы продаж описывают снижение цены продукта из-за дефектов продукта. Он предоставляется после покупки покупателем продукта. Продажи возвращаются просто, когда клиент возвращает товар. Возврат может быть выполнен только с разрешения возвратного товара.
Валовые продажи — это не конечная общая выручка от компании, но они отражают общую сумму выручки, полученную в течение определенного периода.
Валовые продажи составляют денежные средства, кредитные карты, дебетовые карты и продажи кредитов. Они могут вводить в заблуждение, если они сообщаются как одна позиция, поскольку они завышают фактический объем продаж.

Что такое чистая продажа?
Это общая сумма продаж после вычетов. Эти вычеты — это доходы, скидки и скидки. Чистые продажи контрастируют с валовыми продажами. Это просто валовые продажи за вычетом скидок, возвратов и надбавок. Когда вычеты высоки, тогда происходит снижение продаж в сети и наоборот.
Как только разница между чистыми продажами и валовыми продажами компании больше, чем в целом по отрасли, компания может предоставлять большие скидки или может быть чрезмерная отдача. Чистые продажи дают более точную картину продаж, произведенной компанией, а также показывают, что компания ожидает получить в конце определенного периода.
Они помогают компании измерить линию верха. Компания также может сравнить свои валовые и чистые продажи с другими компаниями в той же отрасли, чтобы выявлять проблемы раньше, а не заниматься финансовым бременем позже.
Это сумма, на которую смотрят многие инвесторы и аналитики при рассмотрении отчета о прибылях и убытках компании при оценке состояния здоровья компании и о том, инвестировать ли она, поскольку она помогает им прогнозировать будущие доходы компании.
Некоторые из выводов, сделанных для получения чистых продаж, включают:
- Резервы продаж: это снижение цен, оплаченных из-за дефектов.
- Скидки для продажи: к ним относятся такие скидки, как вычет 2%, если покупатель платит в течение десяти дней с момента выставления счета.
- Возврат продаж: это включает в себя возврат средств на предварительно купленный товар.
Разница между валовыми и чистыми продажами
Определение Gross Vs. Чистые продажи
Валовые продажи — это общая сумма продаж без каких-либо вычетов, тогда как чистые продажи — это общий объем продаж после вычетов из валовых продаж.
Количество
Валовые продажи всегда выше, чем чистые продажи, из-за того, что чистая прибыль получена из вычетов из валовых продаж.
зависимость
Чистая прибыль всегда зависит от валовых продаж.
Расчет валового Vs. Чистые продажи
Чтобы получить валовые продажи, вы принимаете проданные единицы, умножая их на цену продажи для каждой единицы. Чтобы получить чистые продажи, вы берете валовые продажи и меньше вычетов (прибыли, скидки и скидки).
Вычет расходов
Операционные расходы вычитаются из валовых продаж, тогда как нефинансовые расходы вычитаются из чистых продаж
Актуальность
Чистые продажи гораздо важнее при принятии решений, чем валовые продажи. Дайте лучшую картину текущего финансового положения компании.
Сравнительная таблица для Gross Vs. Чистые продажи

Резюме брутто Vs. Чистые продажи
- Эти два типа продаж тесно переплетаются, так как чистые продажи являются частью валовых продаж, так как для получения чистых продаж приходится рассчитывать валовые продажи.
- Они оба рассчитаны для конкретного финансового года, и они полезны для сравнения как внутри, так и снаружи.
- Эти два субъекта помогают проанализировать, насколько эффективно и эффективно используются ресурсы компании.
- Они влияют на решения, принимаемые текущими акционерами, потенциальными акционерами и инвесторами, а также позволяют организации пересматривать свои цели и составлять необходимые планы для достижения своих долгосрочных целей.
- Оба они имеют отношение по-своему, и они являются неотъемлемой частью финансового анализа общего дохода от бизнеса.
Рекомендуемые

Samsung Gravity 2 и Samsung Gravity 3

Samsung HZ30W и Samsung HZ35W

Samsung Galaxy S и Nokia N8
Рекомендуемые

Побочные эффекты и побочные эффекты
Побочные эффекты против побочных эффектов Побочные эффекты и побочные эффекты испытывают люди в области здравоохранения. Часто слова заменяются или используются вместо другого, но это неправильно. Существует большая разница в значении обоих слов. Побочным эффектом любого вещества является эффект, выходящий за пределы главного или

Генеральный директор HR и HR-менеджер
Хотя оба они принадлежат отделу кадров, существует разница между HR Generalist и HR-менеджером, главным образом с точки зрения их ролей и обязанностей. Менеджер по персоналу, вероятно, является одной из наиболее важных частей организации. Он или она управляет полным отделом, который состоит из группы людей
Mastering gross sales: what it is, how to calculate it, and examples
A re you looking to improve your revenue analysis and decision-making for your business? Calculating gross sales is a crucial starting point. But what exactly are gross sales, how do they differ from net sales, and how can you use them to your advantage?
This comprehensive guide will explore the answers to these questions and provide practical examples and insights into mastering gross sales calculations.
What is Gross Sales?
Gross sales refers to the total revenue generated from all sales of a business prior to any deductions. This is the raw number, untouched by discounts, returns, or any other costs.
In a B2C context, gross sales refer to the amount of money a business earns from selling its products or services without factoring in any costs incurred during business operations. For example, if you sold 1000 t-shirts at $20 each, your gross sales would simply be $20,000.
In a B2B scenario, the calculation may involve more complexity. B2B transactions often involve larger volumes and contractual agreements, which can include bulk discounts and payment terms. Therefore, gross sales is the total amount invoiced to other businesses before any adjustments.
Gross Sales vs. Net Sales: Unveiling the Difference
Gross sales doesn’t take into account any expenses or costs associated with running the business. Hence, when evaluating a business’s financial health, you should consider other metrics like net sales.
Net sales represent the revenue after certain deductions. These deductions can include costs of goods sold, returns, allowances, and discounts. Simply put, net sales show what’s left after deducting sales-related expenses from gross sales.
The terms “gross profit” and “net profit” take this a step further. Gross profit is gross sales minus the cost of goods sold. It’s the profit made after subtracting the cost of creating the product but before operational costs. Net profit, however, is the bottom line. It’s the profit remaining after all costs, taxes, and expenses have been deducted from net sales.
As a business owner, you should understand the difference between gross sales and net sales, as well as gross profit and net profit. By analyzing these metrics, you can accurately assess your company’s performance and make informed decisions to improve profitability.
The Gross Sales Formula: Unlocking the Calculation
For Business With One Revenue Stream
If you’re running a business with only one revenue stream, the gross sales formula is quite straightforward:
Gross Sales = Units Sold x Sale Price.
This formula involves two components: the number of units sold and the sale price per unit. Let’s break it down.
Units sold represent the total number of products or services your business has sold within a specific period. It helps you understand the total market demand your business is meeting. Accurate tracking and data collection of units sold is essential to ensure your gross sales calculation is as precise as possible.
Sale price signifies the amount charged to the customer for each unit sold. This value can fluctuate depending on discounts, promotions, and other price-altering factors. It’s crucial to keep these in mind when calculating your gross sales.
For example, if your business sold 100 product units at $20 each, your gross sales would be $2,000. This figure provides an initial overview of your revenue before any deductions like discounts, returns, and taxes are considered.
For Business With Multiple Revenue Streams
When a business has multiple revenue streams, calculating gross sales can be slightly more complex. You’ll need to determine the gross sales for each revenue stream individually and then sum them up to obtain the total gross sales.
The formula for calculating gross sales with multiple revenue streams is as follows:
Total Gross Sales = Gross Sales of Revenue Stream 1 + Gross Sales of Revenue Stream 2 + … + Gross Sales of Revenue Stream n
For instance, suppose a software company generates revenue from two distinct sources: software licenses and consulting services. If the gross sales for software licenses amount to $50,000 and the gross sales for consulting services amount to $30,000, the total gross sales would be:
Total Gross Sales = $50,000 + $30,000 = $80,000
The Net Sales Formula: Revealing the Net Revenue
To calculate net sales, you must first determine your gross sales. From there, you subtract any returns or refunds, discounts, and allowances to arrive at the net sales figure. This formula is expressed as:
Net Sales = Gross Sales – (Returns + Discounts + Allowances)
Returns, discounts, and allowances can considerably reduce a company’s gross sales. Sales returns are products that customers have returned. Sales discounts are price reductions given to customers. And sales allowances are reductions in the selling price granted for damaged goods or minor discrepancies.
Net sales paint a far more accurate picture than gross sales. It takes into account the fact that not all sales contribute to profitability. By deducting returns, discounts, and allowances, the net sales formula reveals the revenue that actually makes the bottom line.
Why is net sales important? Because net sales — not gross sales — is used to calculate gross margin, a critical profitability metric. It also gives stakeholders a clearer picture of the company’s financial health.
Understanding the Gross Sales Formula: Key Insights and Examples
Let’s look at some key factors that can affect your gross sales: pricing strategies, sales volume, inventory, and market trends.
Pricing Strategies
A well-executed pricing strategy can boost revenue, while an ineffective one can lead to missed opportunities. For instance, a premium pricing strategy positions a product as high-quality or exclusive, potentially increasing profit margins.
On the other hand, a penetration pricing strategy, where prices are set low to gain market share, can stimulate sales volume and expand customer reach. Finding the optimal balance between pricing and customer value is essential for maximizing gross sales.
Sales Volumes
Sales volume, or the number of units sold, directly impacts gross sales. It’s a fundamental driver of revenue growth, irrespective of pricing strategies.
Increasing sales volume can be achieved through effective marketing campaigns, expanding distribution channels, or improving customer service. By focusing on increasing sales volume while maintaining reasonable pricing, you can experience substantial gross sales growth.
Say an e-commerce retailer runs a flash sale and offers a 40% discount on best-selling electronic gadgets. This limited-time promotion attracts a large number of customers, resulting in a surge in sales volume and a significant boost in gross sales.
Inventory
Too little inventory could result in missed sales opportunities, while too much could lead to unsold products, especially those with expiration dates. Amazon uses a just-in-time inventory strategy, ensuring optimal inventory levels that cater to customer demands without tying up too much capital in stock. This approach can help maintain a steady flow of sales while minimizing financial risk.
By implementing robust inventory forecasting techniques, you can ensure optimal stock levels, minimize inventory write-offs, and capture potential sales. Additionally, inventory turnover metrics can provide valuable insights into sales patterns and guide decision-making.
Market Trends
Monitoring and adapting to market trends is essential for sustaining gross sales growth. Market trends encompass changes in consumer preferences, industry dynamics, and emerging technologies. By staying ahead of the curve, you can align your product offerings and marketing strategies with evolving customer needs.
This proactive approach enables you to capture new market opportunities, maintain competitive advantage, and ultimately drive gross sales growth.
Example: A Practical Walkthrough on Finding Gross Sales
Suppose you’re the owner of an online shoe store that has been gaining popularity among shoe enthusiasts.
To determine your gross sales, you’ll need to consider all the revenue generated from selling shoes during a specific period, excluding any deductions such as discounts, returns, or taxes.
Step 1: Collect the necessary information related to your shoe sales. This includes the total quantity of shoes sold and their corresponding prices over a given timeframe, say a month.
For instance, in May, you sold 500 pairs of shoes at an average price of $80 per pair.
Step 2: Multiply the number of shoes sold by the average price per pair to find the gross sales figure.
Gross sales = Quantity sold × Price per pair
In May, the calculation would be as follows:
Gross sales = 500 pairs × $80 = $40,000
Therefore, your gross sales in May amounted to $40,000.
Let’s take another example. You’re running a medicine subscription business that operates both a subscription service and sells products through one-off purchases.
To determine your gross sales, follow these steps:
1. Identify revenue streams: You’re generating revenue through recurring monthly subscriptions and one-time product purchases.
2. Calculate subscription revenue: Calculate the revenue generated from monthly subscriptions. Consider the number of active subscribers and the monthly subscription fee. For instance, if you have 500 active subscribers paying $50 per month, your monthly subscription revenue would be $50 multiplied by 500, resulting in $25,000.
3. Determine product sales revenue: Calculate the revenue from one-off product purchases. Take into account the number of products sold and their respective prices. Let’s assume you sold 200 products during the month, with an average price of $30 per product. The product sales revenue would then amount to $30 multiplied by 200, which equals $6,000.
4. Summarize gross sales: To find the total gross sales, combine the revenue from subscriptions and product sales. In this example, the subscription revenue of $25,000 and the product sales revenue of $6,000 would yield a total gross sales figure of $31,000.
What Gross Sales Can Tell You: Insights into Revenue Performance
Gross sales data holds a wealth of information that can offer invaluable insights into revenue performance. By examining this metric, you can uncover sales trends, evaluate revenue generation, and gauge your progress toward sales targets.
Let’s look at the significance of tracking gross sales and why you need to do it today.
Analyzing Revenue During a Specific Period: Uncover Trends and Patterns
By studying the fluctuations in gross sales figures over time, you can spot emerging trends and adapt accordingly.
For instance, a sudden surge in sales during holiday seasons may indicate the importance of seasonal promotions or the need to expand product offerings to cater to increased demand. On the other hand, a prolonged period of stagnant sales might prompt a reevaluation of marketing tactics or product positioning.
Consumer Buying Trends: Harnessing Gross Sales Data for Strategic Decision-making
Analyzing gross sales data allows you to identify shifts in customer behaviours, such as changes in product preferences or purchasing habits.
With this knowledge, you can tailor your marketing efforts to target specific customer segments or adjust your product offerings to meet evolving demands. This data-driven approach can lead to increased customer satisfaction, improved market positioning, and, ultimately, enhanced revenue generation.
Moreover, gross sales data can guide strategic decision-making by providing a benchmark against which performance can be measured.
By setting sales targets and comparing actual sales figures to these objectives, you can gauge your progress and identify areas of strength or weakness. This information allows for strategic adjustments, such as reallocating resources to high-performing areas or implementing initiatives to improve underperforming segments.
Calculate Gross Sales for Your Store: Optimize Performance and Growth
Once you have calculated your gross sales and gained valuable insights, it’s essential to translate that knowledge into actionable strategies. Consider analyzing sales data to identify your most profitable customer segments or demographics. Tailor your marketing efforts and product offerings to resonate with these target audiences, thereby increasing customer engagement and loyalty.
Additionally, evaluate the effectiveness of your pricing strategy and explore opportunities for upselling or cross-selling to boost average transaction values.
By accurately calculating and analyzing gross sales, you gain invaluable insights into your store’s financial performance, which can drive growth, inform strategic decision-making, and optimize sales strategies.
To help you further, consider using modern sales tracking and analytic tools. They not only help you to calculate gross sales but also track trends and provide actionable insights. Tools like Revenue Grid Analytics can provide in-depth analysis, making the task of gross sales calculation and analysis simpler and more precise.
Analyze gross sales with Revenue Grid
Gross sales might not tell the entire story of your business’s financial health, but they provide a strong starting point for your journey towards financial success. So keep it in your business toolkit from now on.
Прибыль, доходы и финансовая результативность бизнеса
Получение прибыли и высокой отдачи на инвестированный капитал — финансовые цели номер один для бизнеса. Иногда, правда, вспоминаются и другие приоритеты, такие как удовлетворение потребностей рынка, строжайшее соблюдение интересов всех стейкхолдеров или реализация какой-либо глобально значимой миссии. Однако, на деле здесь не обходится без доли лукавства, поскольку без достаточного профита эти цели вряд ли будут столь уж интересны собственникам.
Итак, как же оценить прибыль? Как пробраться через частокол коэффициентов, иностранных и не очень названий? Как подобрать нужные для себя коэффициенты и как их правильно интерпретировать?
Кроме того, надо признать очевидный факт, что в систему финансового анализа уже давно вошли и закрепились иностранные термины. Конечно, можно было бы и дальше продолжать оперировать прибылью и рентабельностью, но тогда вы, возможно, если и не закрываете, то уж точно прикрываете некоторые двери в деловой мир. Но когда приходит время (а оно обязательно придёт для компании, которая развивается) общаться с банками и инвесторами, выясняется, что существуют какие-то показатели, которыми оперируют финансовые институты, а они в вашем случае или как-то неоднозначно звучат, или звучат не очень. И теряем мы на сделках прибыль, так как не можем вовремя получить деньги в оборот или отрабатываем кредиты с повышенной ставкой.
Давайте постепенно разбираться.
В западной практике для обозначения дохода и прибыли как финансовой квинтэссенции бизнеса используется ряд близких по звучанию, но различных по содержанию, показателей: Net Income и Net Profit , Total Revenue и Net Sales , Net Profit Margin и Gross Profit Margin . Нельзя сказать, что показатели эти только-только вошли в нашу действительность, однако факт наличия вокруг них некоего ореола туманности и загадочности (а можно и “загадочной туманности”, кому как удобнее), остаётся очевидным.
И часто задаваемыми вопросами здесь являются следующие:
Нет профит и гросс профит — в чём между ними основная разница?
Net Profit и Net Income — одно и то же? Или нет?
Наконец, в чём измеряется Gross Profit Margin, и что этот показатель реально означает на практике?
Что ж, попробуем развеять возникшую туманность и пролить свет на истинную суть данных показателей, заодно разобравшись — “that is that” и что, с чем и каким образом соотносится.
Total Revenue и Net Sales
Начать предлагаем с самого сверху, а если точнее — с самых верхних строчек отчёта о финансовых результатах, где, собственно, и аккумулируются предпосылки для получения прибыли. Речь идет о том, что в верхних позициях отчёта о финансовых результатах представлены такие показатели, как чистые продажи (Net Sales) и чистый доход (выручка) от реализации (Revenue).
Чистые продажи представляют собой разницу между валовыми продажами (Gross Sales) и всеми скидками, возвратами и другими предоставленными покупателям бонусами. Что касается показателя Revenue , то он имеет более широкое по сравнению с Net Sales значение — в него включены не только доходы от продажи основной продукции, но и другие виды доходов, в том числе и от неосновной деятельности.
Gross Profit, Net Profit и Net Income
Показатели Net Sales и Revenue , по сути, отражают доходную часть бизнеса компании. Однако это ещё не прибыль, поскольку для её получения нужно произвести определенные действия, обязательно сопряженные с затратами.
Если же из показателя чистого дохода от продаж продукции (Net Sales) вычесть те затраты, которые компания понесла на её непосредственное изготовление, на выходе мы получим показатель Gross Profit , в переводе означающий валовую прибыль. В данном случае можно записать следующее выражение:
Gross Profit = Net Sales − Cost of goods sold
Важно помнить, что к сумме Cost of goods sold , т. е. к стоимости реализованных товаров, относятся только связанные с ними прямые затраты. Например, если речь идёт о затратах на покупку сырья и материалов, либо же заработной плате работникам завода, то такие затраты относятся к стоимости реализованных товаров.
Если же говорить об административных или операционных издержках (например, заработная плата руководства компании или расходы по аренде и содержанию офиса), то они не включаются в Cost of goods sold , соответственно — не учитываются при расчёте гросс профит .
Указанные издержи берутся во внимание при расчёте показателя чистой прибыли компании — Net Profit. Если брать буквально, то показатель Net Profit (перевод дословно с английского: “чистый доход”) представляет собой прибыль, которую получает компания после:
покрытия всех операционных издержек (Total Operating Expenses, TOE);
выплат причитающихся кредиторам процентов (Interest Expense, IE) и налогов государству (Taxes)
Net Profit = Gross Profit − TOE − IE − Tax
В целом логика формирования показателя Net Profit должна быть ясна и понятна даже тем, кто никогда не сталкивался с международными учётными стандартами и показателями, однако работал с их отечественными аналогами. Наиболее близкий по смыслу к “нет профит” — чистая прибыль после налогообложения.
Другой близкий по смыслу показатель — Net Income . Он представляет собой чистый денежный поток, остающийся в распоряжении предприятия после покрытия всех затрат на ведение хозяйственной деятельности. Грубо говоря, это остаток наличности, которым располагает бизнес на выходе. При расчёте Net Income сумма валовой прибыли корректируется за счёт:
покрытия суммарных эксплуатационных затрат (SG&A expenses);
компенсации расходов на исследования и разработки (R & D);
покрытия суммы износа и амортизации оборудования (Depreciation and amortization , DA);
уплаты процентов по кредитам (Interest Expense, IE) и налогов (Taxes).
Net Income = Gross Profit − SG&A − R&D − DA − IE − Tax
Net Profit Margin и Gross Profit Margin
Показатели Gross Profit , Net Profit и Net Income характеризуют количественную сторону прибыльности бизнеса и показывают, сколько соответствующей прибыли способна генерировать компания — в рублях, долларах США, фунтах стерлингов и любой другой валюте.
Однако, знание того, что компания заработала за прошлый год, скажем 1,5 миллиона USD Gross Profit , а ее Net Profit составила 720 тысяч USD , не позволяет ответить на пару важных вопросов:
насколько хорошо сработал бизнес?
насколько велик запас его устойчивости, например, к снижению цены или росту прямых издержек?
Вот здесь на помощь и приходят относительные показатели маржинальности (в нашей классической интерпретации — прибыльности или рентабельности), величина которых выражается в процентах — Net Profit Margin и Gross Profit Margin.
Так, Net Profit Margin (NPM), оцениваемый как соотношение чистой прибыли (Net Profit) к доходу от продаж (Net Sales) или выручке (Revenue), в сущности представляет собой классический показатель чистой рентабельности реализации. Скажем, значение NPM на уровне 10% означает, что каждый рубль продаж или оборота гарантирует компании получение 10 копеек чистой прибыли.
С Гросс профит маржин всё обстоит аналогично, только в числителе вместо Net Profit используется показатель валовой прибыли — Gross Profit. Этот показатель является индикатором маржинальности продаж и показывает, какая часть дохода от продажи останется в распоряжении компании после того, как та покроет затраты (Cost of goods sold), напрямую связанные с реализованной продукцией.
Надеемся, что мы хоть немного помогли разложить по полочкам все эти определения и их показатели.
Но именно немного. На практике все результаты и коэффициенты должны подвергаться тщательному анализу и интерпретации. Не торопитесь хвататься за голову, разносить вдребезги бухгалтеров и финансистов и, конечно, даже не пытайтесь что-то подчистить или подправить в случае, если коэффициенты и показатели будете обсуждать с инвесторами, банками, акционерами. У любого результата есть логическое объяснение. Обязательно надо всё подвергать тщательному анализу, мониторить показатели в динамике.